Applying Computational Statistics to eSports
Motivation
Sports analytics is popular for major sports broadcastings such as the NBA, NFL, and MLB with well known broadcasting time slots dedicating to talking about performances and statistics. However, there’s only so much data you can take from traditional sports - you can’t tell the amount of power Christian Ronaldo will kick with or how long until Stephan Curry runs out of stamina.
One of the most up and coming industries is competitive video gaming - also known as, esports (electronic sports) - arguably has significantly more statistics, and better documented data than traditional sports. The biggest issue is that not enough data professionals exists, but there are plenty of Reddit Analysts.
Within sports is a heavy and (very) profitable industry in sports betting. One could totally YOLO it, but there are studies in mathematics such as computational statistics that can inform consumers to make the most educated bets.
What is computational statistics?
Great question. Computational statistics (or statistical computing - tomato tomato), is the intersection between statistics and computer science, where it is used to take advantage of the ever increasing computational power in our computers to design and implement algorithms that can apply statistical methods to large quantities of data. Before the age of computers, this type of problem was thought to be almost impossible. Concepts such as monte carlo simulations, markov chains, neural networks, and kernel density estimation fall within computational statistics.
Overview:
This project will cover the application of computation statistics on the most popular eSport, League of Legends. It’s application, however, is honestly applicable to almost all sports.
The concepts I’ve focused on are Monte Carlo simulations, Kernel Density Estimation, and Bootstrapping. These implementations were done in R and can be found on my GitHub: https://github.com/ishengy/MonteCarloSim_LCS
ELI5 of the Math Stuff:
Monte Carlo simulations: split a room in half by drawing a line down the middle. Chuck a ball into the room and record the final resting place of that ball. Repeat this procedure as many times as you need. You should eventually notice that the ball rests on either half of the room the same number of times.
Bootstrapping: The year is 1998 - you insert your copy of Pokemon Red into your Gameboy and prepare make your way though Mount Moon. Throughout this journey, you’ve experience a wonderful 35 Zubats, 10 Geodudes, 9 Sandshrews, and 1 Clefairy. That’s around a 70% rate of Zubats. Without having to experience that nightmare once again (because let’s face it, no one wants a Zubat if it can’t evolve into a Crobat yet), you can estimate the “true” Zubat rates by repeatedly sampling X number of Pokemon from your encounters over and over and over and over …and over again. Until you have Y Zubat rates. That’s your bootstrapped Zubat rate distribution!
Kernel Density Estimation: You have a histogram, and you want to calculate a line that would somewhat accurately trace the peaks of each histogram bar.
Crash Course on League of Legends:
League of Legends is a 5 vs 5 game where each player picks one of 5 roles (top, mid, jungle, ad carry, support) and one of over 150 champions (characters) to play. It's played on a map where each team has a base, and there are 3 lanes between them with 3 turrets/towers per lane. Each role traditionally belongs to a section of the map, where they largely remain for the first 10 minutes or so. The main goal is to destroy the opposing team’s nexus (circled in white) by securing objectives (destroying turrets and inhibitors), generating gold (killing enemy champions, neutral monsters, etc), and winning fights.

Crash Course on League of Legends eSports:
Most popular online video game with 115 million monthly players and a peak of 50 million daily players.
3rd most popular major professional sports league in the United States among 18-34 year olds based on live average minute audience (AMA).
Events have sold out major stadiums such as Madison Square Garden (NYC), Staples Center (LA), Birds Nest (Beijing), Mercedes-Benz Arena (Berlin), SSE Arena (London), Seoul World Cup Stadium (Seoul), etc.
10 teams in the North American LCS (League Championship Series) with a main roster of 5, and a minor-league (academy) team of 5 that can be substituted in and out of
ETL Procedure:
In-game match statistics for 2019 and 2020 were imported into R
Data for the “training” set was filtered for the most recent year of games that don’t include the season to be simulated (Summer 2019 & Spring 2020).
Earned Gold per Minute (Earned GPM) was the chosen performance metric to determine winning games.
If any player had under 36 games (the minimum number of games for a year), the data would be bootstrapped up to that minimum amount.
Kernel Density Estimates were calculated for each player’s Earned GPM data set.
“Test” set was filtered for the season in question (Summer 2020) in order to create the most recent rosters
Bootstrap Example:

Kernel Density Estimation Example:

Why only Earned GPM?

Long Answer: Because there are 5 roles in the game, and over 150 champions to choose from, not all role+champions combinations can be measured solely on damage dealt, damage absorbed, health healed, etc. For the most part, gold isn’t role dependent. In fact, having more gold than other players in the same position is a high-level way to tell if a player performed better because faster rates of gold generation require more skill and knowledge. Also, since game time varies based on play-style, performance metrics need to be normalized so longer game times that result in more gold don’t equate to better performance
Short Answer: I didn’t have time.
Monte Carlo Simulation - Round Robin Procedure:
Each player was distributed to their respective teams based on the Summer 2020 dataset. To lower complexity, the starting 5 player for the main roster was dependent on who played the most number of games per role.
There are 10 teams in the LCS in total, and each team plays the other 9 teams twice for a total of 18 matches per team.
Each opposing team will have random variates drawn from each of their player’s kernel density estimates for an earned gold per minute value. The winner is determined by whichever team had the highest total.
Running monte carlo simulations, this round robin format was simulated 1,000 times (or 18*1,000 matches in total).
A table with the resulting win percentages of each team at the end of all simulations was calculated.
Monte Carlo Simulation - Round Robin Results:
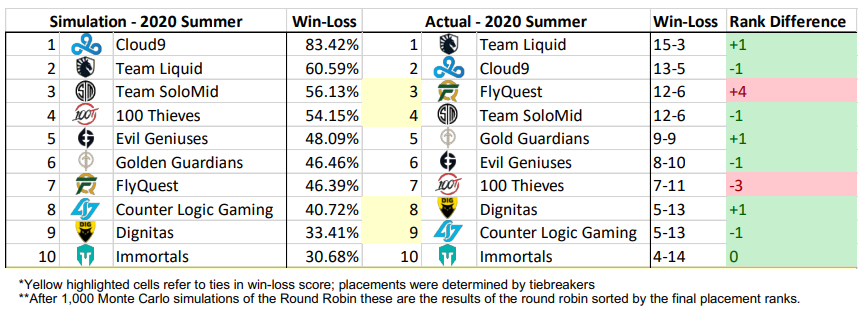
Most of the placements were only off by +/- 1 rank.
Looking at the actual resulting win-loss score, most of these teams were also only a couple wins away from each other during the 2020 Summer season.
FlyQuest and 100 Thieves seemed to have severely overperformed and underperformed, respectively, in the actual round robin
Monte Carlo Simulation - Playoff Bracket Format:

Monte Carlo Simulation - Playoff Bracket
At this point of the simulation, the actual seeding for the 2020 Summer Playoffs was used instead of the one generated from the simulation.
2019 Summer data was replaced with the actual 2020 Summer Round Robin results, and the kernel density estimations were re-calculated.
Each match during playoffs is a best of 5 (meaning the first team to win 3 times out of 5, wins the match), so each Monte Carlo simulation ran until a team acquired 3 total wins.
Two win percentages are acquired per match after running the Monte Carlo simulation 1,000 times, determining the winner and loser of that series.
1,000 Simulated Playoff Results:
Note: Red boxes - eliminated from playoffs
Actual Playoff Results:
Note: Red boxes - eliminated from playoffs
Simulated versus Actual Results:
Most of the placements were only off by +/- 1 rank. Digging into the training data, Cloud9 was heavily favored after strong previous performances, but failed to show up in the latter half of Summer 2020. Looking at their overall year performance, they won:
17/18 of their spring round robin games, 9/10 of their spring playoff games
9/9 of their first half summer round robin games
4/9 of their second half summer round robin games.
This big dip in performance would explain why the simulation placed Cloud9 as the winner so dominantly. At first, the overwhelmingly one-sided tournament almost seems like it rendered the simulation invalid. But let’s take a look at the last three actual playoff matches :

The games between FlyQuest, Team SoloMid, and Team Liquid were all extremely competitive during both the simulation and actual playoffs – any of them could’ve advanced over the other in single simulations.
This begs the question: What if a weighting was applied to provide heavier emphasis on more recent performances? The results might turn out closer to the actual playoff results since Cloud9 would have been heavily penalized for their recent underperformance.